
Graphs are a powerful tool to visually represent data and understand relationships between variables. Class 8 Math Ch 15 Introduction to Graph Ex 15.3 focuses on drawing and interpreting linear graphs based on real-life situations. It helps students develop the skill of plotting points on a graph and understanding how changes in values reflect visually.
By practicing Class 8 Math Ch 15 Introduction to Graph Ex 15.3, students learn how to analyze trends, compare quantities, and draw conclusions from line graphs. This exercise strengthens their ability to connect mathematical data with its graphical representation, a skill useful in various subjects and real-world applications.
Class 8 Math Ch 15 Introduction to Graph Ex 15.3 – Textbook
Ex 15.3 Class 8 Maths Question 1.
Draw the graphs for the following tables of values, with suitable scales on the axes.
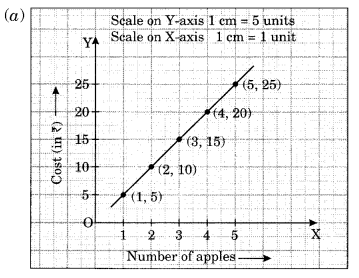
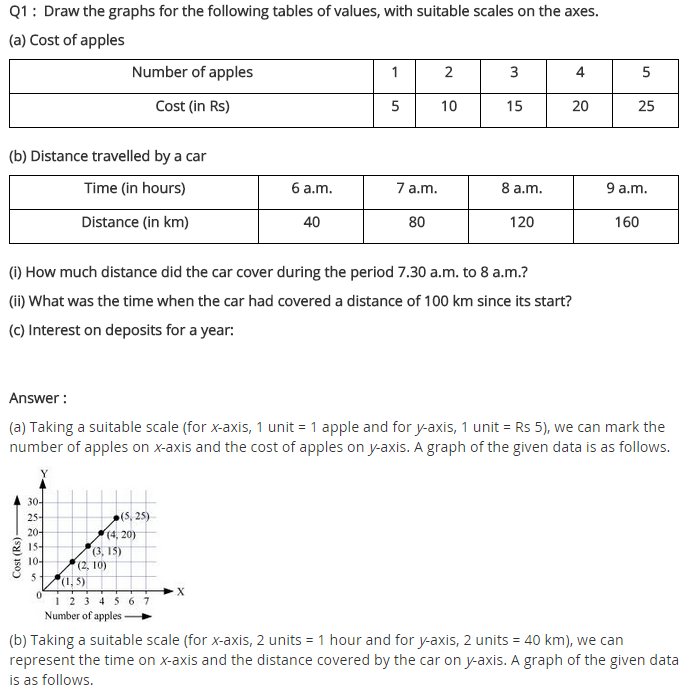
(a) Cost of apples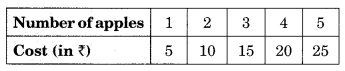
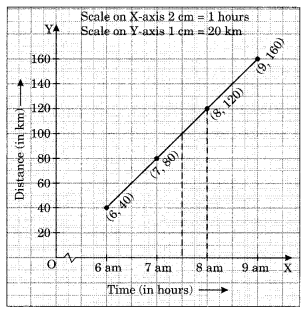
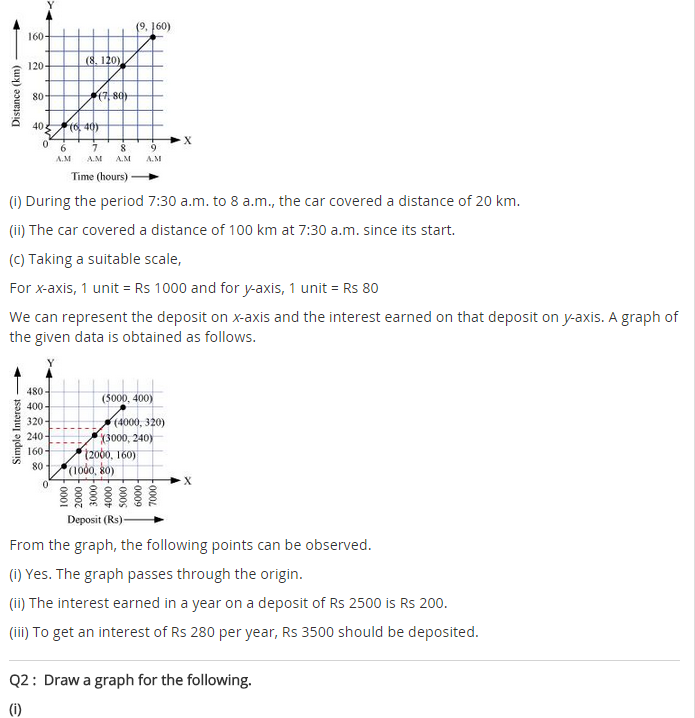
(b) Distance travelled by car.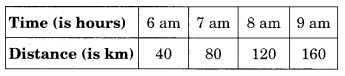
(i) How much distance did the car cover during the period 7:30 am to 8 am?
(ii) What was the time when the car had covered a distance of 100 km since its start?
NCERT books
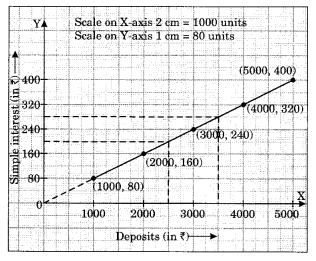
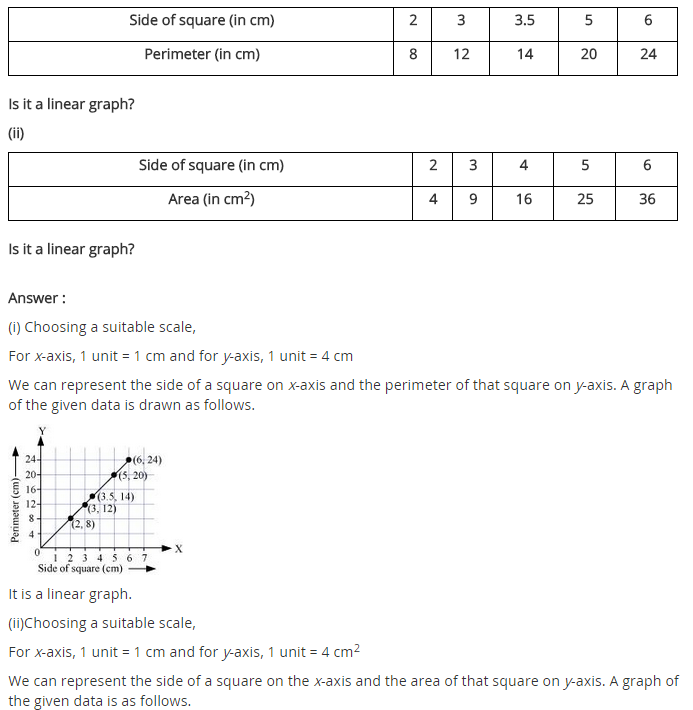
(c) Interest on deposits for a year.
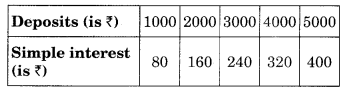
(i) Does the graph pass through the origin?
(ii) Use the graph to find the interest on ? 2500 for a year.
(iii) To get an interest of t 280 per year, how much money should be deposited?
Solution:
(b) (i) The distance covered by the car during the period 7:30 am to 8 am is (120 km – 100 km) = 20 km.
(ii) At 7:30 am, the car had covered a distance of 100 km.
(c) (i) Yes, the graph passes through the origin,
(ii The interest on ₹ 2500 is ₹ 200 for 1 year.
(iii) ₹ 3500 should be invested to earn the interest of ₹ 280.
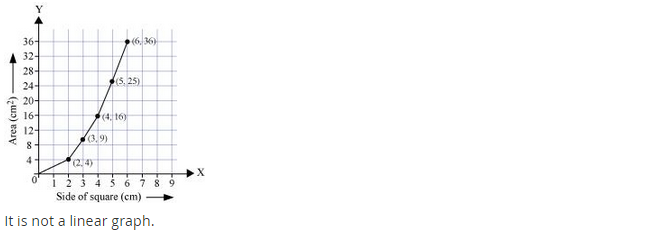
Ex 15.3 Class 8 Maths Question 2.
Draw the graph for the following: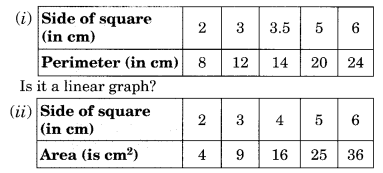
Solution: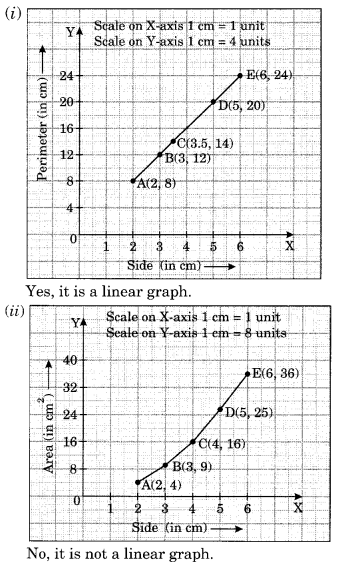
📘 Math & Science Solutions by Class
🔹 Class 10
🔹 Class 9
🔹 Class 8
🔹 Class 7
🔹 Class 6
🔹 Class 12
🔹 Class 11
- Class 11 Math Solutions
- Class 11 Physics Solutions
- Class 11 Chemistry Solutions
- Class 11 Biology Solutions
Understanding how to represent and interpret data using graphs is an essential math skill. Class 8 Math Ch 15 Introduction to Graph Ex 15.3 provides students with practical experience in drawing and analyzing linear graphs. This exercise builds a clear understanding of how two variables can be related and how their relationship can be shown visually through a straight line on a graph.
Through solving the questions in Class 8 Math Ch 15 Introduction to Graph Ex 15.3, students learn to plot coordinate points, observe patterns, and make informed predictions. These are not just academic skills but are useful in science, economics, and everyday problem-solving situations.
The problems in Class 8 Math Ch 15 Introduction to Graph Ex 15.3 also enhance critical thinking and improve data interpretation skills. As students practice, they gain confidence in converting tabular data into graphical format and understanding how changes in values affect the graph’s shape and direction.
In summary, Class 8 Math Ch 15 Introduction to Graph Ex 15.3 plays a vital role in helping students visualize mathematical relationships. Mastering this exercise prepares them for more advanced graph-related topics in higher classes and builds a strong foundation in analytical thinking.
For the official Class 8 Mathematics Solutions, you can visit:
- NCERT Textbooks (for Class 8):