
Class 8 Maths Chapter 5 Data Handling Ex 5.2-NCERT introduces the concept of probability in a simple and engaging way. This exercise helps students understand how to calculate the likelihood of an event occurring using basic examples like tossing a coin or rolling a die. Through these problems, students learn to interpret data and make predictions based on outcomes. It builds a strong foundation for understanding chance and uncertainty, which are important not only in math but also in real-life decision-making. Solving Exercise 5.2 develops logical thinking and analytical skills in a fun and practical manner.
Class 8 Maths Chapter 5 Data Handling Ex 5.2-NCERT Textbook
Question 1.
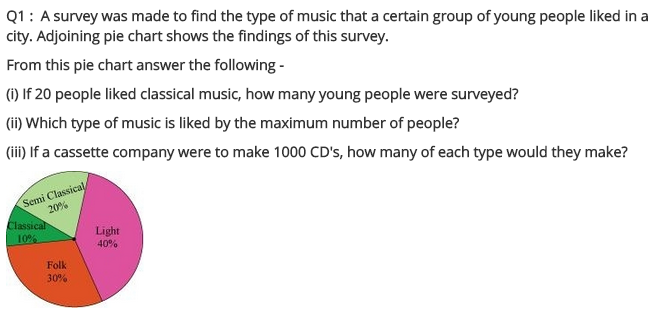
A survey was made to find the type of music that a certain group of young people liked in a city. The adjoining pie chart shows the findings of this survey.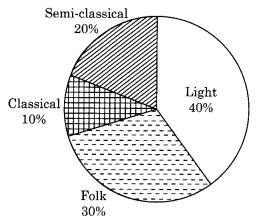
From this pie chart answer the following:
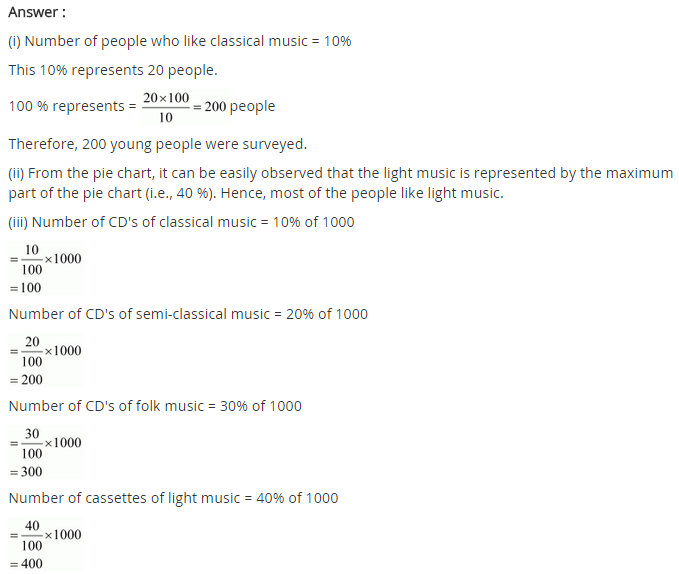
(i) If 20 people liked classical music, how many young people were surveyed?
(ii) Which type of music is liked by the maximum number of people?
(iii) If a cassette company were to make 1000 CDs. How many of each type would they make?
Solution:
(i) Number of young people who were surveyed = [Math Processing Error] = 200 people.
(ii) Light music is liked by the maximum people, i.e., 40%
(iii) Total number of CD = 1000
Number of viewers who like classical music = [Math Processing Error] = 100
Number of viewer who like semi-classical music = [Math Processing Error] = 200
Number of viewers who like light music = [Math Processing Error] = 400
Number of viewers who like folk music = [Math Processing Error] = 300
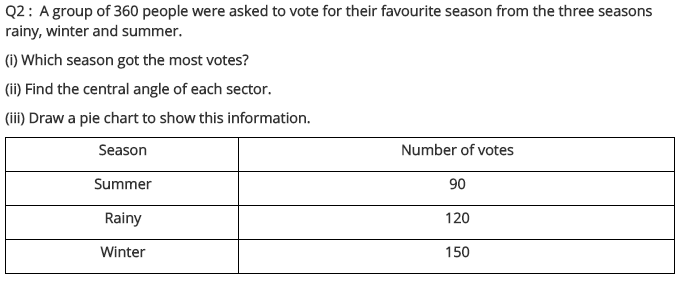
Ex 5.2 Class 8 Maths Question 2.
A group of 360 people were asked to vote for their favourite season from the three seasons rainy, winter and summer.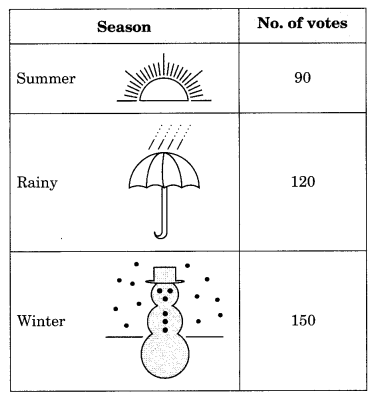
(i) Which season got the most votes?
(ii) Find the central angle of each sector.
(iii) Draw a pie chart to show this information.
Solution:
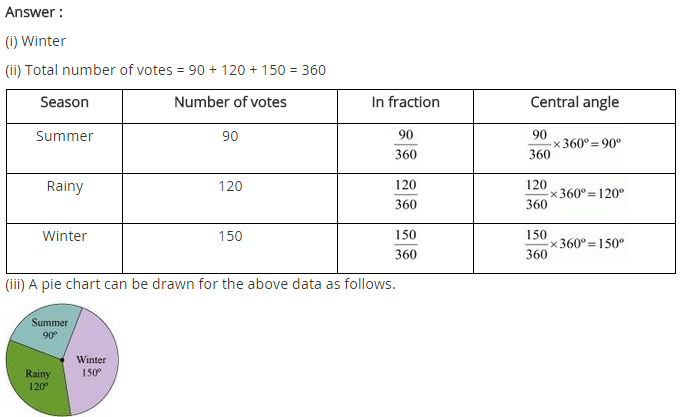
(i) Winter season got the most votes, i.e. 150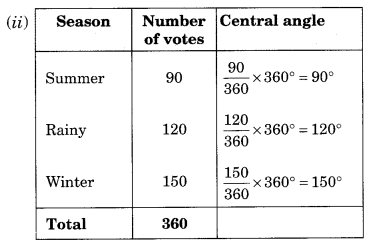
(iii) Pie chart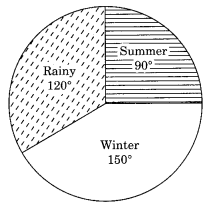
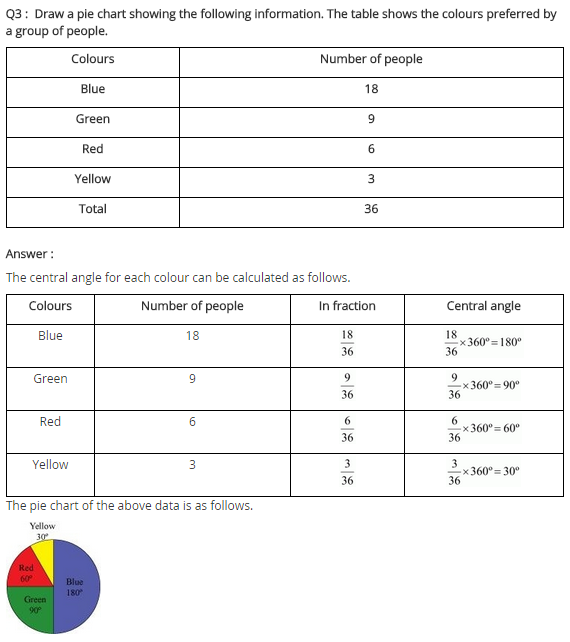
Ex 5.2 Class 8 Maths Question 3.
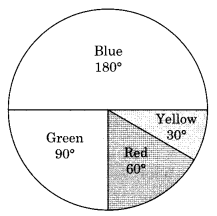
Draw a pie chart showing the following information. The table shows the colours preferred by a group of people.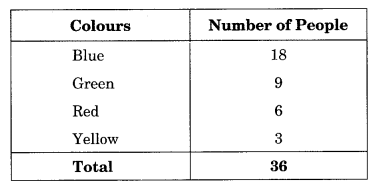
Solution:
Table to find the central angle of each sector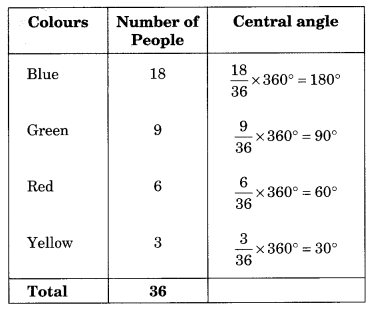
Ex 5.2 Class 8 Maths Question 4.
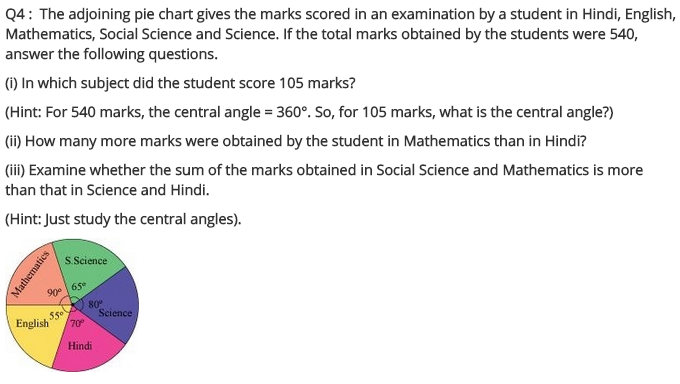
The following pie chart gives the marks scored in an examination by a student in Hindi, English, Mathematics, Social Science and Science. If the total marks obtained by the students were 540, answer the following questions.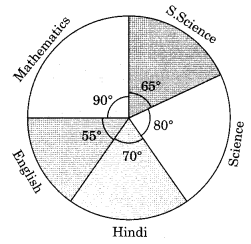
(i) In which subject did the student score 105 marks?
(Hint: for 540 marks, the central angle = 360°. So, for 105 marks, what is the central angle?)
(iii) Examine whether the sum of the marks obtained in Social Science and Mathematics is more than that in Science and Hindi.
(Hint: Just study the central angles).
Solution: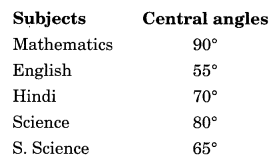
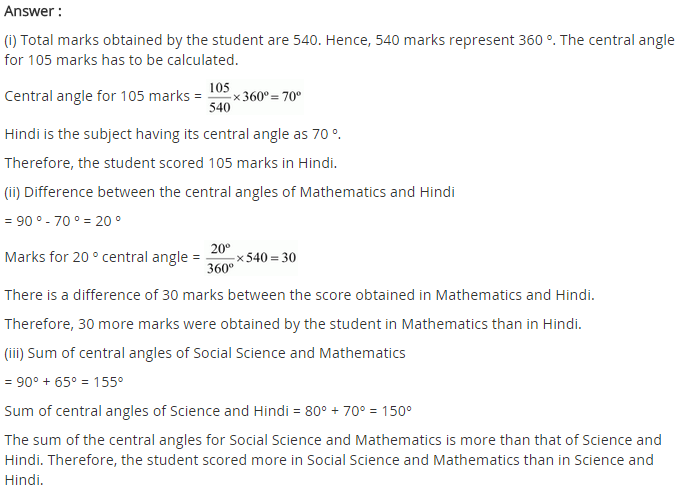
(i) For 540 marks, the central angle = 360°
For 105 marks the central angle = [Math Processing Error] = 70°
Corresponding subject = Hindi
(ii) Marks obtained in Mathematics = [Math Processing Error] = 135
Marks obtained in Mathematics more than Hindi = 135 – 105 = 30
(iii) Central angle of Social Science + Mathematics = 65° + 90° = 155°
Central angle of Science + Hindi = 80° + 70° = 150°
Ex 5.2 Class 8 Maths Question 5.
Marks obtained in Social Science and Mathematics are more than that of the marks obtained in Science and Hindi.
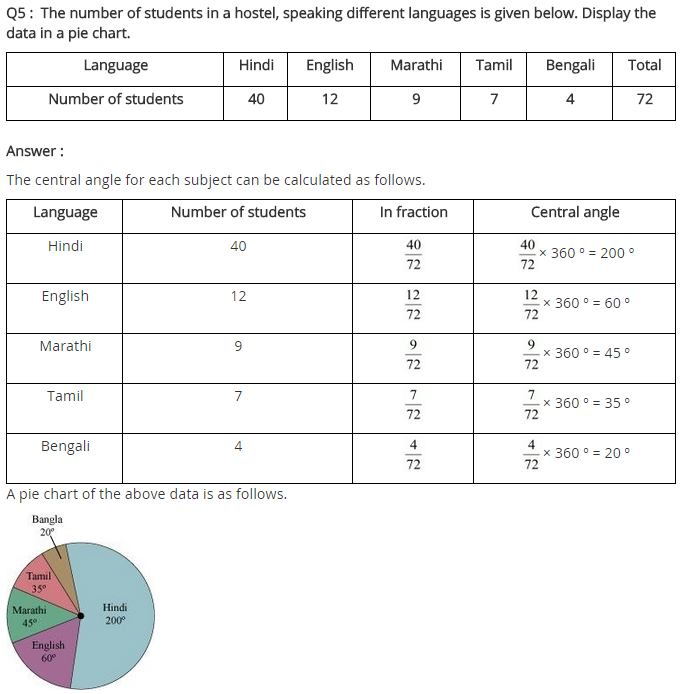
The number of students in a hostel, speaking different languages is given below. Display the data in a pie chart.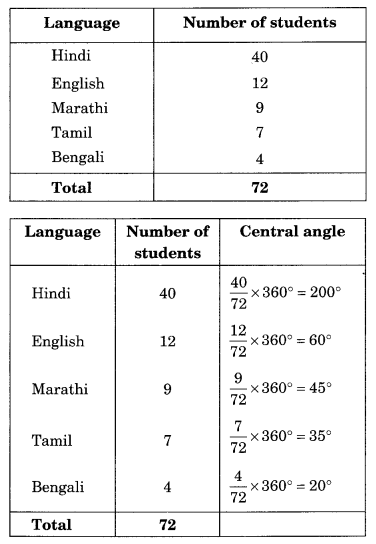
Solution: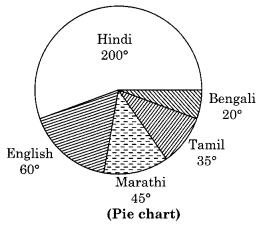
📘 Math & Science Solutions by Class
🔹 Class 10
🔹 Class 9
🔹 Class 8
🔹 Class 7
🔹 Class 6
🔹 Class 12
🔹 Class 11
- Class 11 Math Solutions
- Class 11 Physics Solutions
- Class 11 Chemistry Solutions
- Class 11 Biology Solutions
For the official Class 10 Mathematics Solutions, you can visit:
- NCERT Textbooks (for Class 10):