
Describing Motion
Complete Chapter Overview, Concepts, Formulas & Examples
1. Introduction to Motion
Motion is one of the most common phenomena in our surroundings. Cars move on roads, birds fly in the sky, planets revolve around the Sun, and people walk from one place to another.
In this chapter, we learn how to describe the motion of an object using quantities such as distance, displacement, speed, velocity and acceleration.
To describe motion scientifically, we need to know the position of an object and how its position changes with time.
Motion means a change in the position of an object with respect to a reference point as time passes.
2. What is Motion?
An object is said to be in motion if its position changes with time relative to a reference point.
Reference Point
A reference point is a fixed point with respect to which we observe the position or motion of an object.
Suppose you are sitting inside a moving bus. You are at rest with respect to another passenger sitting beside you, but you are in motion with respect to a person standing on the road.
Motion is relative. An object can be at rest relative to one reference point and in motion relative to another.
3. Distance and Displacement
Distance
Distance is the total length of the actual path travelled by an object from its initial position to its final position.
Distance
Type: Scalar quantity
Unit: metre (m)
It has magnitude only.
Displacement
Type: Vector quantity
Unit: metre (m)
It has magnitude and direction.
Displacement
Displacement is the shortest distance between the initial and final positions of an object, measured in a particular direction.
Distance depends on the actual path travelled, whereas displacement depends only on the initial and final positions.
A student walks 3 metres east and then 4 metres north. The total distance travelled is:
Distance = 3 + 4 = 7 m
The magnitude of displacement is:
Displacement = √(3² + 4²) = 5 m
Distance vs Displacement
| Distance | Displacement |
|---|---|
| Actual path travelled | Shortest path between initial and final positions |
| Scalar quantity | Vector quantity |
| Has magnitude only | Has magnitude and direction |
| Always positive or zero | Can be positive, negative or zero depending on direction |
4. Speed
Speed tells us how fast an object is moving. It is defined as the distance travelled by an object per unit time.
Average Speed
Average speed is the ratio of the total distance travelled to the total time taken.
Uniform Speed
If an object covers equal distances in equal intervals of time, it is said to have uniform speed.
Non-uniform Speed
If an object covers unequal distances in equal intervals of time, its speed is non-uniform.
A car travels 120 km in 3 hours. Find its average speed.
Average Speed = 120 / 3
Average Speed = 40 km/h
5. Velocity
Velocity is the rate of change of displacement with time.
Velocity is a vector quantity because it has both magnitude and direction.
Difference Between Speed and Velocity
| Speed | Velocity |
|---|---|
| Based on distance | Based on displacement |
| Scalar quantity | Vector quantity |
| Direction is not required | Direction is required |
| Cannot be negative | Can change depending on direction |
Speed tells us how fast an object moves, while velocity tells us how fast and in which direction the object moves.
6. Acceleration
Acceleration is the rate of change of velocity with respect to time.
The SI unit of acceleration is m/s².
Positive Acceleration
When the velocity of an object increases with time, its acceleration is positive.
Negative Acceleration
When the velocity decreases with time, the acceleration is negative. This is commonly called deceleration or retardation.
A car increases its velocity from 10 m/s to 30 m/s in 5 seconds. Find its acceleration.
a = (v – u) / t
a = (30 – 10) / 5
a = 4 m/s²
7. Uniform and Non-uniform Motion
Uniform Motion
An object is said to be in uniform motion when it covers equal distances in equal intervals of time.
Example: A train travelling at a constant speed in a straight line.
Non-uniform Motion
An object is in non-uniform motion when its speed or direction changes with time.
Example: A car moving through city traffic.
8. Graphical Representation of Motion
Graphs are useful for studying how the position, distance and velocity of an object change with time.
Distance-Time Graph
A distance-time graph shows the relationship between distance travelled and time taken.
The slope of a distance-time graph gives the speed of the object.
Speed = Slope of distance-time graph
Velocity-Time Graph
A velocity-time graph represents the relationship between velocity and time.
- The slope of a velocity-time graph gives acceleration.
- The area under a velocity-time graph gives displacement.
9. Equations of Motion
When an object moves with uniform acceleration, we can use three important equations known as the equations of motion.
Meaning of Symbols
| Symbol | Meaning | SI Unit |
|---|---|---|
| u | Initial velocity | m/s |
| v | Final velocity | m/s |
| a | Acceleration | m/s² |
| t | Time | s |
| s | Displacement | m |
These equations are applicable when the acceleration of the object is uniform.
10. Uniform Circular Motion
When an object moves along a circular path with constant speed, the motion is called uniform circular motion.
- Motion of the hands of a clock.
- A satellite revolving around Earth.
- A stone tied to a string and rotated in a circle.
- Motion of a point on a rotating fan.
Although the speed may remain constant, the direction of motion continuously changes. Since velocity depends on both speed and direction, the velocity changes continuously.
An object moving with constant speed in a circular path is still accelerating because its direction of velocity changes continuously.
11. Important Formulas at a Glance
Speed
Speed = Distance / Time
Velocity
Velocity = Displacement / Time
Acceleration
a = (v – u) / t
First Equation
v = u + at
Second Equation
s = ut + ½at²
Third Equation
v² = u² + 2as
12. Chapter Summary
- Motion is the change in position of an object with time relative to a reference point.
- Distance is the total path travelled by an object.
- Displacement is the shortest distance between the initial and final positions in a particular direction.
- Speed is the distance travelled per unit time.
- Velocity is the displacement travelled per unit time.
- Acceleration is the rate of change of velocity.
- The slope of a distance-time graph represents speed.
- The slope of a velocity-time graph represents acceleration.
- The area under a velocity-time graph represents displacement.
- The equations of motion are applicable to objects moving with uniform acceleration.
- An object moving in a circle at constant speed is accelerating because its direction continuously changes.
13. Exam Preparation Tips
For Theory Questions
- Learn the definitions of distance, displacement, speed, velocity and acceleration.
- Understand the difference between scalar and vector quantities.
- Remember the differences between distance and displacement.
- Understand why circular motion involves acceleration.
For Numerical Problems
- Write the values given in the question.
- Convert all quantities into SI units when required.
- Choose the correct formula.
- Substitute the values carefully.
- Always write the final answer with the correct unit.
Class 9 New Science Book 2026 Ch4 Describing Motion – Textbook Answers
Solved Questions & Numericals from New Text Book
The following questions help you understand the concepts of distance, displacement, velocity, acceleration and equations of motion.
Distance and Displacement
My father went to a shop from home which is located at a distance of 250 m on a straight road. On reaching there, he discovered that he forgot to carry a cloth bag. He came home to take it, went to the shop again, bought provisions and came back home. How much was the total distance travelled by him? What was his displacement from home?
Solution
Distance between home and shop = 250 m
Movement of father:
Total distance travelled:
Therefore, the total distance travelled = 1000 m.
Since he finally returned home, his initial and final positions are the same.
Distance and Displacement on Different Floors
A student runs from the ground floor to the fourth floor of a school building to collect a book and then comes down to their classroom on the second floor. If the height of each floor is 3 m, find:
- the total vertical distance travelled, and
- their displacement from the starting point.
Solution
Height of each floor = 3 m
Step 1: Ground Floor → Fourth Floor
Number of floors crossed = 4
Step 2: Fourth Floor → Second Floor
Number of floors moved down = 2
(i) Total Vertical Distance
Therefore, the total vertical distance travelled = 18 m.
(ii) Displacement from Starting Point
Starting point = Ground floor
Final point = Second floor
The student is finally 2 floors above the starting point.
Can an Object Accelerate at Constant Speed?
A girl is riding her scooter and finds that its speedometer reading is constant. Is it possible for her scooter to be accelerating and if so, how?
Solution
Yes, it is possible.
Acceleration occurs whenever there is a change in velocity.
Velocity can change when:
- the speed changes, or
- the direction of motion changes.
If the girl turns the scooter along a curved road, the direction of motion changes continuously.
Therefore, the velocity of the scooter changes even though its speed remains constant.
Acceleration and Distance Travelled
A car starts from rest and its velocity reaches 24 m/s in 6 s. Find the average acceleration and the distance travelled in these 6 seconds.
Solution
Given:
- Initial velocity, u = 0 m/s
- Final velocity, v = 24 m/s
- Time, t = 6 s
Step 1: Calculate Acceleration
We use the formula:
Substituting the values:
a = 24 / 6
a = 4 m/s²
Step 2: Calculate Distance
We use the equation:
Substituting the values:
s = 0 + ½ × 4 × 36
s = 72 m
Average acceleration = 4 m/s²
Distance travelled = 72 m
Finding Acceleration and Time
A motorbike moving with an initial velocity of 28 m/s and constant acceleration stops after travelling 98 m. Find the acceleration of the motorbike and the time taken to come to a stop.
Solution
Given:
- Initial velocity, u = 28 m/s
- Final velocity, v = 0 m/s
- Distance travelled, s = 98 m
Step 1: Calculate Acceleration
We use the third equation of motion:
Substituting the values:
0 = 784 + 196a
196a = −784
a = −4 m/s²
The negative sign indicates that the motorbike is slowing down.
Step 2: Calculate Time
We use the first equation of motion:
Substituting the values:
4t = 28
t = 7 s
Acceleration = −4 m/s²
Time taken to stop = 7 s
Quick Revision of These Questions
| Question | Main Concept | Final Answer |
|---|---|---|
| 1 | Distance & Displacement | Distance = 1000 m, Displacement = 0 m |
| 2 | Distance & Displacement | Distance = 18 m, Displacement = 6 m upward |
| 3 | Acceleration & Direction | Yes, changing direction causes acceleration |
| 4 | Acceleration & Distance | Acceleration = 4 m/s², Distance = 72 m |
| 5 | Equations of Motion | Acceleration = −4 m/s², Time = 7 s |
Do Objects A and B Ever Have Equal Velocity?
Fig. 4.27 shows a position–time graph of two objects A and B that are moving along parallel tracks in the same direction.
Do objects A and B ever have equal velocity? Justify your answer.
The velocity of an object is equal to the slope of its position–time graph.
In the given graph, the straight lines representing objects A and B have different slopes.
The line for object A is steeper than the line for object B. Therefore, object A has a greater velocity than object B.
The two lines intersect at one point. At this point, both objects have the same position at the same instant. However, their slopes are still different.
Same position does NOT mean same velocity.
The intersection of the two lines tells us that A and B are at the same position at that instant. Equal velocity would require the two position–time graphs to have the same slope.
Objects A and B never have equal velocity because the slopes of their position–time graphs are different.
Position–Time Graph: Choose the Correct Option(s)
A graph in Fig. 4.28 shows the change in position with time for two objects A and B moving in a straight line from 0 to 10 seconds.
Choose the correct option(s).
Average velocity depends on the total displacement and the total time.
Average speed depends on the total distance travelled and the total time.
Both A and B start from the same initial position and reach the same final position at 10 s. Therefore, their displacements are equal.
Since both take the same time of 10 s, their average velocities are equal.
Although both objects take the same time and have the same initial and final positions, this statement is not the correct reason for their average speeds being equal.
However, from the graph both objects move continuously in the same direction without reversing. Therefore, the distance travelled by each object is equal to its displacement.
Hence, their average speeds are also equal. The option’s wording “both cover equal distance in equal time” is true for this graph, so (ii) is also correct.
Object A does not cover a shorter distance than B. Both objects start at the same position and finish at the same position, and neither reverses its direction.
Therefore, both cover the same total distance. So their average speeds are equal, not different.
The fact that B’s speed is lower than A’s during some portions of the journey does not mean that A has a greater average speed.
Average speed depends on the total distance travelled over the total time. Since both cover the same distance in the same 10 s, their average speeds are equal.
Both objects have the same average velocity because they have the same displacement in the same time. They also have the same average speed because they travel the same total distance in the same time.
Calculate the Total Distance Travelled by the Car
A car starts from rest and accelerates uniformly to 20 m s−1 in 5 seconds.
It then travels at 20 m s−1 for 10 seconds and finally applies the brake (with uniform acceleration) to stop in 6 seconds.
Find the total distance travelled by the car.
The car starts from rest:
Since acceleration is uniform, the average velocity is:
= 10 m s−1
Therefore,
= 10 × 5
= 50 m
The car travels at a constant velocity of 20 m s−1 for 10 s.
= 20 × 10
= 200 m
During braking, the car slows uniformly from 20 m s−1 to 0 m s−1 in 6 s.
= 10 m s−1
= 10 × 6
= 60 m
The total distance travelled by the car is 310 metres.
If your accompanying figure shows a car speed limit of 50 km/h and a truck speed limit of 40 km/h, those speed-limit values are not used in this particular calculation. The question specifically gives the car’s velocities and times as 20 m s−1, 5 s, 10 s and 6 s.
Motion with Acceleration, Constant Speed and Deceleration
A car starts from rest and accelerates uniformly to 20 m s−1 in 5 seconds.
It then travels at constant speed for 10 seconds before decelerating uniformly to rest in 5 seconds.
Find:
- The acceleration
- The deceleration
- The total distance travelled
- The total time of the journey
Velocity–Time Graph
The area under a velocity–time graph represents the distance travelled.
Solution
① Acceleration
Given:
a = 4 m s−2
② Deceleration
During deceleration:
a = −4 m s−2
Therefore, the deceleration is:
③ Total Distance Travelled
We divide the journey into three parts.
Part 1: Acceleration
= ½(0 + 20) × 5
= 50 m
Part 2: Constant Speed
= 20 × 10
= 200 m
Part 3: Deceleration
= ½(20 + 0) × 5
= 50 m
= 300 m
④ Total Time of Journey
= 20 s
(a) Acceleration = 4 m s−2
(b) Deceleration = 4 m s−2
(c) Total distance = 300 m
(d) Total time = 20 s
Can the Bus Stop Before the Obstacle?
A bus is travelling at 36 km h−1 when the driver sees an obstacle 30 m ahead.
The driver takes 0.5 seconds to react before pressing the brake.
Once the brake is applied, the velocity of the bus reduces with constant acceleration of 2.5 m s−2.
Will the bus be able to stop before reaching the obstacle?
Solution
① Convert the Speed into m/s
② Distance Travelled During Reaction Time
During the reaction time, the driver has not yet applied the brakes. Therefore, the bus continues at 10 m/s.
= 5 m
So, the bus travels 5 m before the brakes are applied.
③ Distance Travelled While Braking
Using:
At the stopping point:
0 = 100 − 5s
5s = 100
s = 20 m
④ Total Stopping Distance
= 5 + 20
= 25 m
The bus needs only 25 m to come to rest, while the obstacle is 30 m away.
Therefore, the bus will stop 5 m before the obstacle.
Is an Object on Earth at Rest or in Motion?
A student said, “The Earth moves around the Sun”.
In this context, discuss whether an object kept on the Earth can be considered to be at rest.
Answer
🔑 Motion is Relative
An object can be considered to be at rest or in motion depending on the reference point chosen.
With respect to Earth
An object kept on the Earth does not change its position with respect to the Earth.
With respect to the Sun
The Earth moves around the Sun. Therefore, an object on Earth also changes its position with respect to the Sun.
Yes, an object kept on the Earth can be considered to be at rest with respect to the Earth. However, the same object is considered to be in motion with respect to the Sun because the Earth is moving around the Sun.
Therefore, rest and motion are relative concepts.
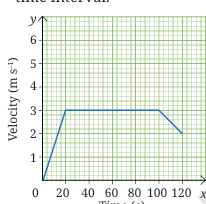
12.The velocity-time graph from 0 s to 120 s for a cyclist is shown in Fig. 4.30. Shade the areas (in different colours) representing the displacement of the cyclist
(i) while cyclist is moving with constant velocity.
(ii) when the velocity of cyclist is decreasing.
Also, calculate the displacement and average acceleration in the 120 s time interval.
Solution
From the graph:
- From to s, velocity increases from to m s−1.
- From s to s, velocity remains constant at m s−1.
- From s to s, velocity decreases from m s−1 to m s−1.
(i) Area representing displacement during constant velocity
The cyclist moves with constant velocity from 20 s to 100 s.
The displacement is represented by the rectangular area under the graph between:
- time = s to s
- velocity = m s
(ii) Area representing displacement when velocity is decreasing
The velocity decreases from s to s.
The displacement is represented by the trapezium-shaped area under the graph between:
- time = 100 s to 120 s
Total displacement
Total displacement = Total area under the velocity-time graph
1. First triangular area (0–20 s)
Using:
2. Rectangular area (20–100 s)
Using:
3. Trapezium area (100–120 s)
Using:
Total displacement
Average acceleration
Using:
Initial velocity, m s
Final velocity, m s
Total time, s
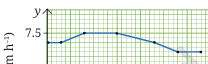
13.A girl is preparing for her first marathon by running on a straight road. She uses a smartwatch to calculate her running speed at different intervals. The graph (Fig. 4.31) depicts her velocity versus time. Estimate the running distance based on the graph.
Solution
The distance travelled is equal to the area under the velocity-time graph.
From the graph, the approximate values are:
| Time (h) | Velocity (km h−1) |
|---|---|
| 0 | 6.5 |
| 1 | 7.5 |
| 2 | 7.5 |
| 3 | 6.5 |
| 4 | 5.5 |
| 5 | 5.5 |
We calculate the area interval by interval using the trapezium formula:
where:
- and are velocities,
- is the time interval.
1. From 0 h to 1 h
2. From 1 h to 2 h
3. From 2 h to 3 h
4. From 3 h to 4 h
5. From 4 h to 5 h
Total running distance
Question 14
On entering a state highway, a car continues to move with a constant velocity of 6 m s−1 for 2 minutes and then accelerates with a constant acceleration of 1 m s−2 for 6 seconds.
Find the displacement of the car on the state highway in the 2 min 6 s time interval by drawing a velocity-time graph for its motion.
Given Information
- Initial constant velocity = 6 m/s
- Time at constant velocity = 2 min = 120 s
- Acceleration = 1 m/s2
- Time of acceleration = 6 s
Step 1: Find the Final Velocity
During the second part of the motion, the car accelerates uniformly. We use:
Therefore, after 6 seconds of acceleration, the velocity becomes 12 m/s.
Step 2: Draw the Velocity-Time Graph
For the first 120 seconds, velocity remains constant at 6 m/s. During the next 6 seconds, velocity increases uniformly from 6 m/s to 12 m/s.
Step 3: Calculate Displacement from the Graph
The displacement is equal to the area under the velocity-time graph.
The graph consists of:
- A rectangle for the first 120 seconds.
- A trapezium for the last 6 seconds.
Part A: Displacement in the First 120 s
Part B: Displacement in the Last 6 s
The area under the velocity-time graph during acceleration is a trapezium.
Step 4: Total Displacement
Quick Summary
| Time Interval | Graph Area | Displacement |
|---|---|---|
| 0–120 s | Rectangle | 720 m |
| 120–126 s | Trapezium | 54 m |
| Total | 774 m | |
The area under a velocity-time graph gives the displacement. Here, the total area is the area of the rectangle plus the area of the trapezium.
Motion of the Tip of a Minute Hand
Question:
Rohan studies science from 6 PM to 7:30 PM at home. Consider the tip of the minute’s hand of the wall clock. During the given time interval, what is its:
- distance travelled,
- displacement,
- speed, and
- velocity.
The length of the minute’s hand is 7 cm.
Given
- Length of minute hand (radius), r = 7 cm
- Initial time = 6:00 PM
- Final time = 7:30 PM
Time interval:
Important Concept
The minute hand of a clock completes one complete revolution in 60 minutes.
Therefore, in 90 minutes, the minute hand completes:
(i) Distance Travelled
The tip of the minute hand moves along a circular path. Therefore, distance travelled is the circumference of the circle multiplied by the number of revolutions.
Circumference of the circular path:
Since the minute hand makes 1.5 revolutions:
Distance = 2πr × 1.5
= 2 × (22/7) × 7 × 1.5
= 44 × 1.5
= 66 cm
(ii) Displacement
From 6:00 PM to 7:30 PM, the minute hand completes 1.5 revolutions.
After 1 complete revolution, the minute hand returns to its original position. After another half revolution, it reaches the position opposite to the starting point.
Therefore, the displacement is equal to the diameter of the circle.
Displacement = 2 × 7
= 14 cm
(iii) Speed
Speed is defined as the distance travelled per unit time.
Distance = 66 cm
Time = 90 minutes
Speed = 66 / 90
Speed = 0.733 cm/min
In SI units:
66 cm = 0.66 m
90 minutes = 5400 s
Speed = 0.66 / 5400
Speed = 1.22 × 10⁻⁴ m/s
(iv) Velocity
Average velocity is defined as displacement divided by the total time taken.
Displacement = 14 cm
Time = 90 minutes
Average Velocity = 14 / 90
Average Velocity = 0.1556 cm/min
Average Velocity ≈ 0.156 cm/min
In SI units:
Displacement = 14 cm = 0.14 m
Time = 5400 s
Average Velocity = 0.14 / 5400
Average Velocity ≈ 2.59 × 10⁻⁵ m/s
Final Answer
💡 Remember
Distance depends on the actual path travelled, whereas displacement depends only on the initial and final positions.
Similarly, speed is based on distance, while average velocity is based on displacement.
Class 9 Updated New Science Book 2026 Solutions
Explore chapter-wise solutions, concepts, explanations, and study resources for the Class 9 Updated New Science Book 2026.
📚 NCERT Solutions & Study Resources
Explore NCERT solutions, Oxford book solutions, Mathematics, Science, Physics, Chemistry, Biology and more — organized class-wise.
🎓 Class 12 — NCERT Solutions
📘 Class 11 — NCERT Solutions
📗 Class 10 — NCERT Solutions
📕 Class 9 — NCERT Solutions
📙 Class 8 — Solutions
📒 Class 7 — Solutions
📓 Class 6 — Solutions
🏛️ Official NCERT Textbooks
Access the official NCERT textbook portal for Class 10 Mathematics and other NCERT textbooks directly from the NCERT website.
Visit Official NCERT Website ↗
Motion is one of the most important concepts in science that helps us understand how objects move around us. In Class 9 New Science Book 2026 Ch4 Describing Motion, students learn about distance, displacement, speed, velocity, acceleration, and different types of motion in a simple and practical way.This chapter explains motion using real-life examples, activities, graphs, and numerical problems. The solutions provided here will help students understand concepts clearly and prepare well for exams and assignments.